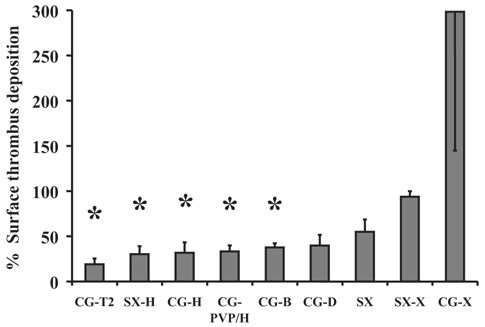
FIG. 6.
The chart displays the percent of surface area covered by visible thrombus deposition following rocking a 3‐cm‐diameter swatch of knitted HFMs in bovine blood for 2 h. The description of the coatings appears in Table 1. The data were normalized so that the percent of deposition on the uncoated Celgard fibers equaled 100. Data shown are the means + standard error, except the CG‐X for which the standard error is shown in the negative. *indicates P ≤ 0.05 versus the uncoated Celgard.

