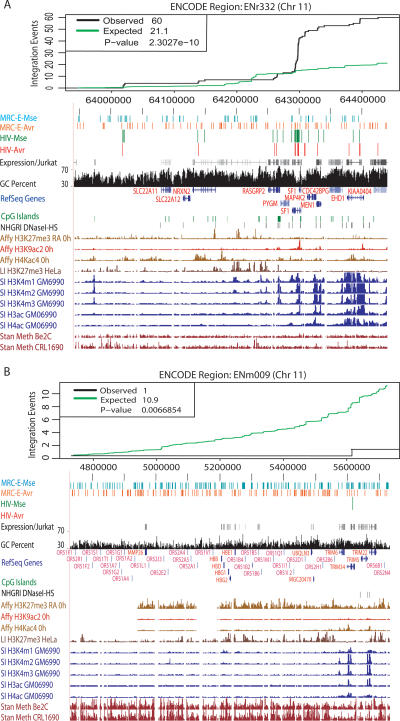
Figure 4.
Integration sites in the ENCODE regions, emphasizing regions that diverge from the multiple regression model. (A) An unexpectedly favorable ENCODE region—ENr332. (B) An unexpectedly disfavorable ENCODE region—ENm009 (beta-globin region). (Top panel) The observed (black line) cumulative histogram of HIV integration events is plotted against the prediction (green line) based on the fitted model as described in Supplemental Data S4. The bottom panel shows the corresponding ENCODE region captured from the UCSC genome browser. The top five tracks are custom annotations: (from top to bottom) the ENCODE-wide matched random controls for the two Mse and Avr integration data sets (MRC-E-Mse and MRC-E-Avr), the experimental HIV-Mse and HIV-Avr integration sites, and transcriptional profiling data from Jurkat cells (shades of gray; highly expressed genes are dark). The genome-wide annotations are shown (from top to bottom): G/C percentage, RefSeq genes, CpG islands, and DNase I hypersensitivity sites. Below are selected ENCODE annotations (from top to bottom): ENCODE tracks showing intensities of various histone post-translational modification in lymphoid cells (GM06990) and DNA CpG methylation. The P-values and observed versus expected numbers of sites are shown on the figure panels.

