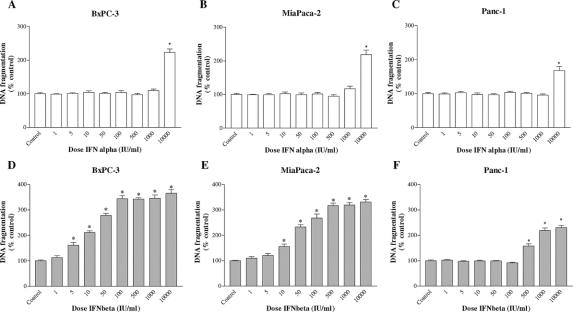
FIGURE 2. Effects of IFN-α (A–C) and IFN-β (D–F) treatment on apoptosis (DNA fragmentation) in BxPC-3, MiaPaCa-2, and Panc-1 cell lines. The cells were incubated for 1 day without (control) or with the drugs indicated at different concentrations. Values are absorbance units and are expressed as percent of the control. Data are the mean ± SEM. *P < 0.001 versus control.

An official website of the United States government
Here's how you know
Official websites use .gov
A
.gov website belongs to an official
government organization in the United States.
Secure .gov websites use HTTPS
A lock (
) or https:// means you've safely
connected to the .gov website. Share sensitive
information only on official, secure websites.
