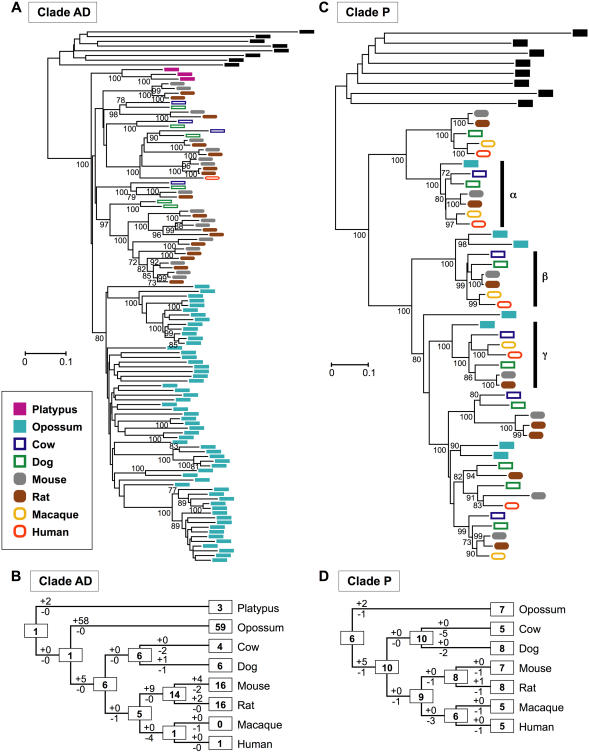
Figure 1. Gains and losses of OR genes during mammalian evolution.
(A) NJ tree for 105 Clade AD genes and eight outgroup genes. The outgroup genes used are human Class II genes belonging to Clades A–H and are shown in black. The number of amino acids used is 288. Bootstrap values were obtained by 500 resamplings, and only the values that are >70% are shown. A scale bar indicates the number of amino acid substitutions per site. (B) Evolutionary changes of the number of Clade AD genes inferred from data in (A). The Euarchontoglires tree topology and a 70% bootstrap condensed tree were used for the estimation. The numbers in rectangular boxes are those of Clade AD functional genes for the extant or ancestral species. The numbers with plus and minus signs for a branch indicate gene gains and losses, respectively. (C) NJ tree for 45 Clade P genes and eight outgroup genes. The number of amino acids used is 290. Bootstrap values >70% are shown. Phylogenetic clades indicated by α and γ contain one gene from each of the seven species (opossums and placentals), and a clade shown by β contains one gene from each of the six placental mammals. (D) Evolutionary changes of the number of Clade P genes inferred from data in (C). Platypuses are not shown, because they lack Clade P genes. A 70% bootstrap condensed tree was used.

