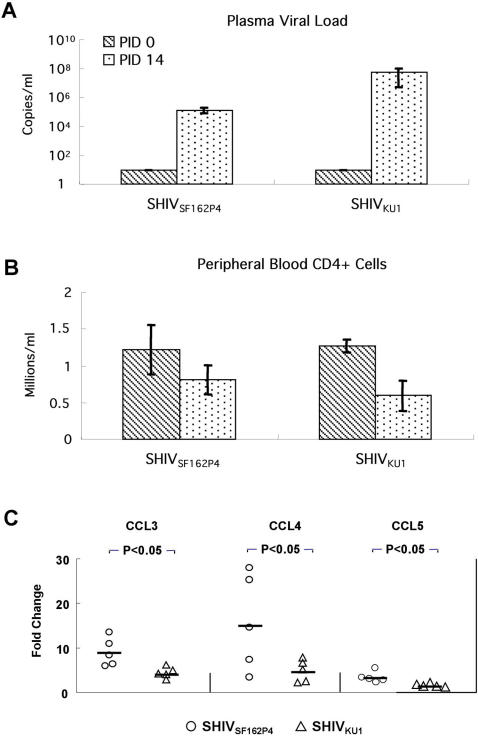
Figure 6. Comparison of SHIVSF162P4 and SHIVKu1 primary infection in peripheral blood.
Viral loads in plasma (A), CD4+ T cell counts (B), Fold-changes of CCL3, CCL4 and CCL5 gene expression levels in SHIVSF162P4- and SHIVKu1–infected macaques at PID 0 vs. PID 14 (C) (n = 5 for each group). Negative sample cut-off for viral load measurements in plasma was <30 copies/ml e.g. PID 0 value.

