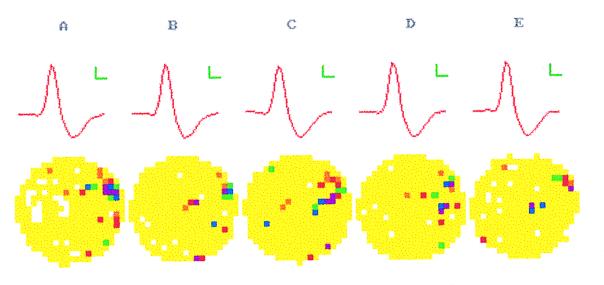
Figure 3.
Activity of a hippocampal PC during pellet chasing in the arena used in Fig. 2 before (A) and during four successive 10-min-long recording periods (B–E) after intraperitoneal injection of scopolamine (1 mg/kg). (Upper) The averaged shape of the selected spike (calibration 60 μV, 0.1 ms). (Lower) The firing rate maps. The median firing rates for the color coded pixels are 0.0, 0.2, 0.5, 1.0, 1.2, and 2.3 for A; 0.0, 0.3, 0.6, 0.9, 1.1, and 1.8 for B; 0.0, 0.1, 0.5, 0.8, 1.3, and 2.0 for C; 0.0, 0.3, 0.5, 1.4, 1.9, and 3.3 for D; 0.0, 0.1, 0.2, 0.3, 0.8, and 1.4 for E. (For quantitative evaluations, see text.)

