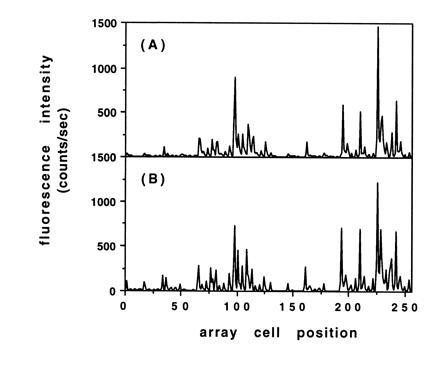
Figure 5.

Comparison of histogram plots of the observed fluorescence intensity due to hybridization for the test arrays shown in Fig. 4 C and D. (A) Array fabricated with the resist bilayer process. (B) Array fabricated with photoactivatible monomers.
