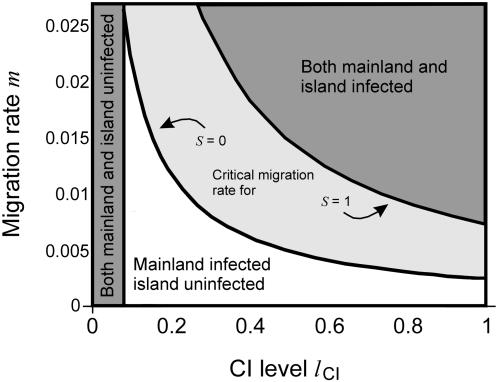
Figure 2. Critical migration rates.
Shown are the critical migration rates (highest migration rates below which post-zygotic isolation stably persists) as a function of the CI level for f = 0.1 and s = 0 or s = 1. The parameter space consists of three regions. If l CI<f then Wolbachia is lost in both populations. If l CI≥f then Wolbachia persists on the mainland and can spread on the island only if migration is above the critical migration rate but cannot if migration is below this threshold. The critical migration rate separates the latter region from the other two and increases with increasing selection coefficient s.

