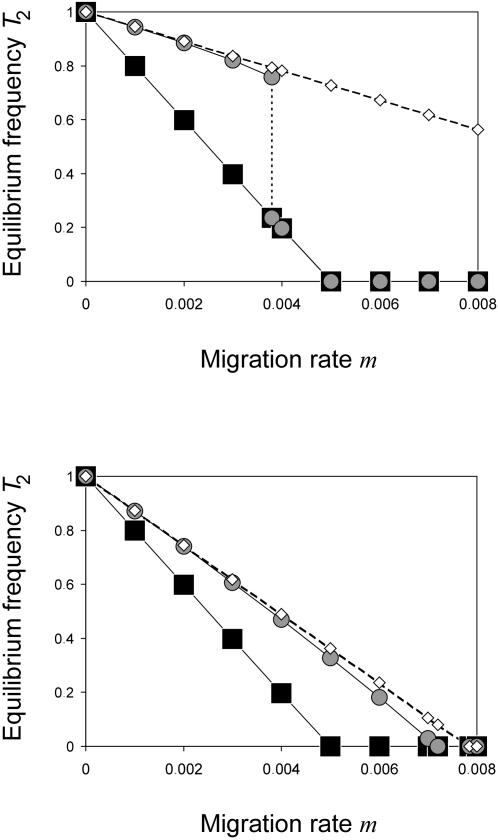
Figure 3. Equilibrium frequencies of T 2 on the island.
Black symbols indicate that both mainland and island are infected with Wolbachia. The frequencies were calculated analytically with formula (5). Gray symbols show numerically determined equilibrium frequencies for starting conditions with an infected mainland and an uninfected island. White diamonds show approximations of the latter case using formula (8). Parameters are f = 0.1, s = 0.005 in both graphs, l CI = 0.7 in (a), and l CI = 0.3 in (b).

