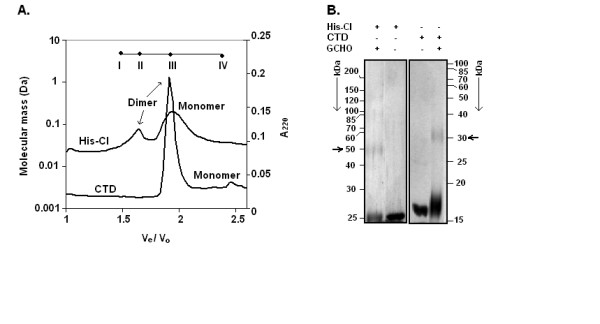
Figure 3.

Oligomerization of His-CI and CTD. (A) Gel filtration analysis. Each protein was loaded onto HPLC gel filtration column and absorbance of eluted fractions was determined at 220 nm. Column was calibrated with BSA (66 kDa, I), ovalbumin (46 kDa, II), carbonic anhydrase (29 kDa, III), and lysozyme (14.4 kDa, IV). Molecular weights were plotted against Ve/Vo, where Ve and Vo denote elution volume and void volume respectively. Void volume of column was determined from elution of blue dextran. (B) Glutaraldehyde (GCHO) cross-linking. Nearly 0.5 μM His-CI or CTD was cross-linked with 0.1% GCHO and samples were analyzed by SDS-10% PAGE. Protein bands were visualized by silver staining. Horizontal arrows denote dimeric His-CI and CTD species.
