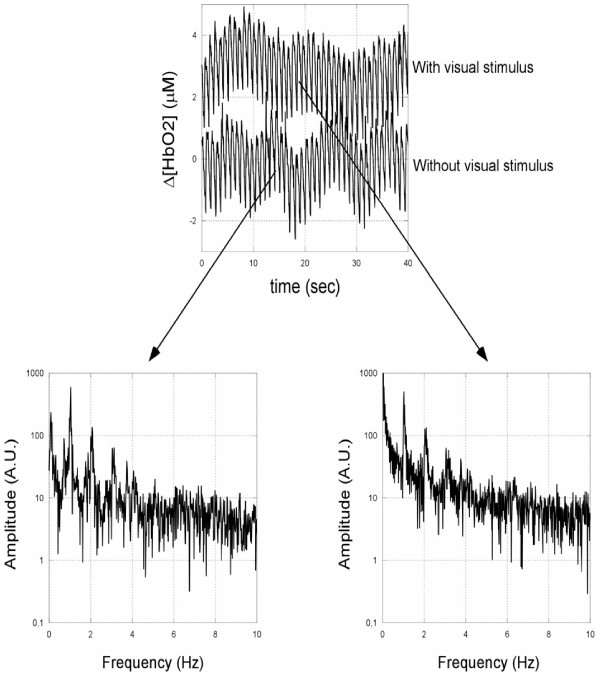
Figure 5.
Oscillatory changes in Δ[HbO2] together with the corresponding power spectral analysis for one subject, typical of the whole group. A pronounced peak at the heart rate frequency around 1 Hz is clearly visible. Around the stimulation frequency, i.e. 8 Hz, both spectra are essentially featureless.

