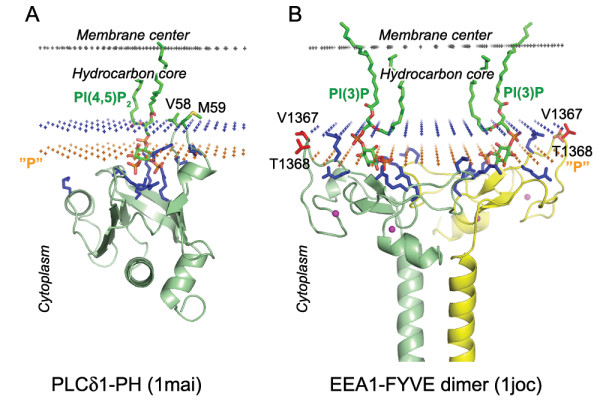
Figure 3.

Calculated membrane binding modes for PH domain of PLCδ1 with lipid ligand PI(4,5)P2 (A) and EEA1-FYVE domain with lipid ligand PI(3)P (B). The backbone of two domains and the specific lipid ligands are shown in ribbon and stick model, respectively. Residues identified as penetrating the non-polar interior of micelles by NMR (and also shown to be important for membrane binding) are colored red. Zn2+ ions (FYVE domain) are shown as balls colored magenta. Cationic residues involved in ligand and membrane interactions are colored blue. Hydrocarbon core boundary at the cytoplasmic side is indicated by blue dots. The layer of lipid phosphates ("P") is shown by gold dots (at 5 Å outside the hydrocarbon boundary). The center of membrane is indicated by grey dots (at 15 Å inside the boundary).
