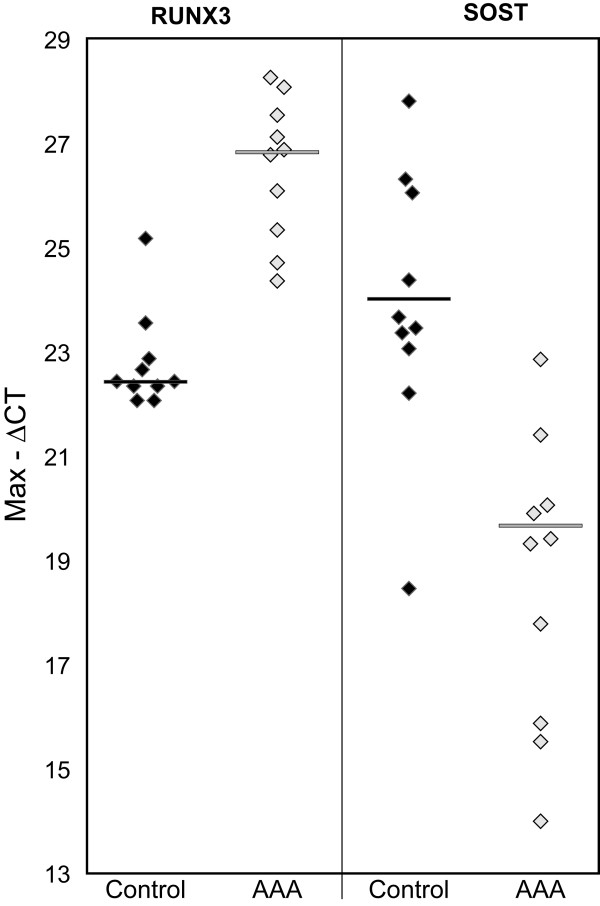
Figure 2.
Q-RT-PCR results for RUNX3 and SOST in AAAs (n = 10) and control abdominal aortas (n = 10). Larger values of Max – ΔCT represent larger amounts of RNA present, and a change of this value by 1 represents a two-fold increase in the amount of mRNA. Medians are indicated by horizontal lines. See Table 1 for details on samples analyzed.

