Figure 3.

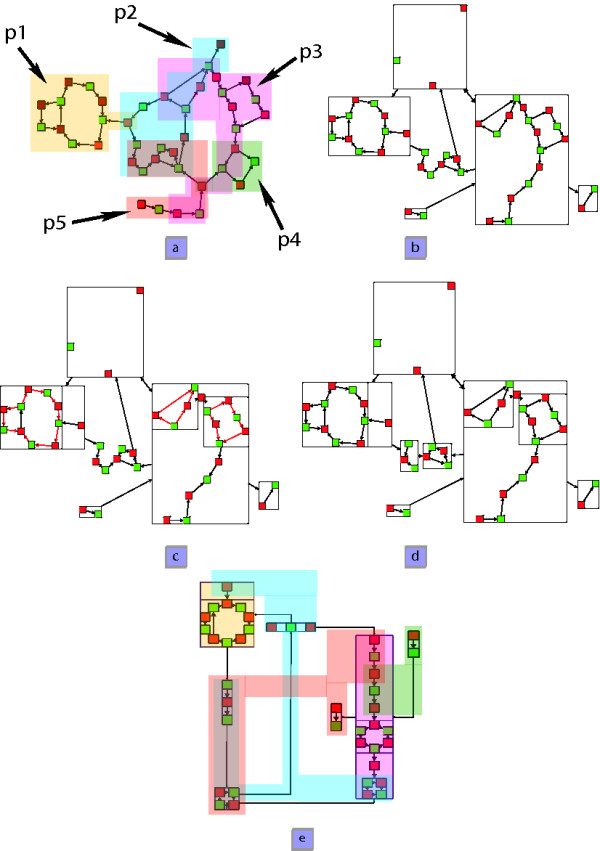
Algorithm overview. (a) a network where each pathway is depicted by a color (b) clustering according to metabolic pathways overlapping (c) cycles detection in metanodes (d) cycles and paths detection (e) final representation

Algorithm overview. (a) a network where each pathway is depicted by a color (b) clustering according to metabolic pathways overlapping (c) cycles detection in metanodes (d) cycles and paths detection (e) final representation