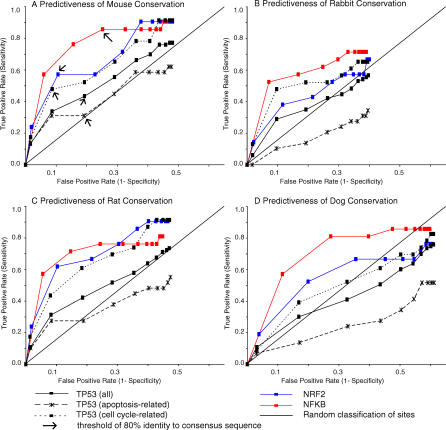
Figure 3. ROC Curves for Four Mammalian Comparisons Indicate the Ability of Different Interspecific Comparisons to Identify Bona Fide Human TFBSs.
(A–D) Using a dataset of experimentally verified human TFBSs and randomly chosen promoter sequences from human genes, the true positive and false positive prediction rates were calculated given conservation thresholds that classify a TFBS as authentic or spurious. Each data point on a curve represents a different conservation threshold for comparison in the indicated species. In (A) arrows indicate the 80% identity threshold. For NFκB 80% identity with mouse is highly predictive for human. Prediction of apoptosis sites are similar to random classification (diagonal line).

