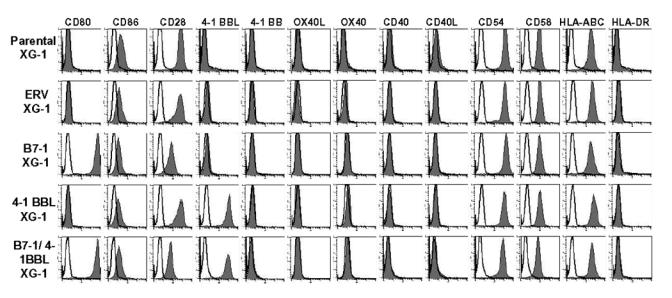
Figure 2. The expression of immune molecules was not affected by retroviral transduction.

The histograms represent the expression levels of various costimulatory molecules indicated in parental XG-1 and transduced XG-1 HMCLs: ERV- XG-1, B7-1 XG-1, 4-1BBL XG-1, and B7-1/4-1BBL XG-1 HMCLs. Expression of the various costimulatory molecules (black histograms) was monitored by FACS analysis. Isotype-matched control mAbs were used (open histograms).
