
Figure 3.
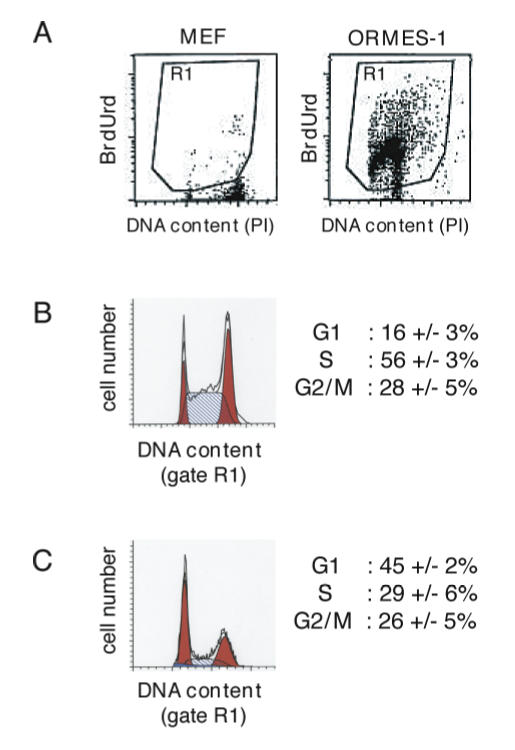
Cell-cycle distribution of ORMES-1 cells as measured by flow cytometry. ORMES-1 cells were grown in the presence of 50 μM BrdUrd for 24 hrs to label all proliferating cells. Cells were then processed for detection of BrdUrd incorporation and analysis of DNA content. (A) Dot plot representation of DNA/BrdUrd biparametric analysis for ORMES-1 and inactivated MEF. DNA was stained with propidium iodide (PI) (x-axis) and BrdUrd (y-axis) was revealed with FITC-conjugated anti-BrdUrd. (B) Histogram representation of the cell-cycle distribution of ORMES-1 cells gated as the BrdUrd+ cell population (gate R1). (C) Histogram representation of the cell-cycle distribution of ORMES-1 after differentiation induced by withdrawal of MEF and culture on gelatine-coated dishes for 1 week. (B,C) Histograms show one representative experiment. Values are means and SEM calculated from three independent replicates. Frequencies of cells in each phase of the cell-cycle were calculated using MODFIT software.