
Figure 4.
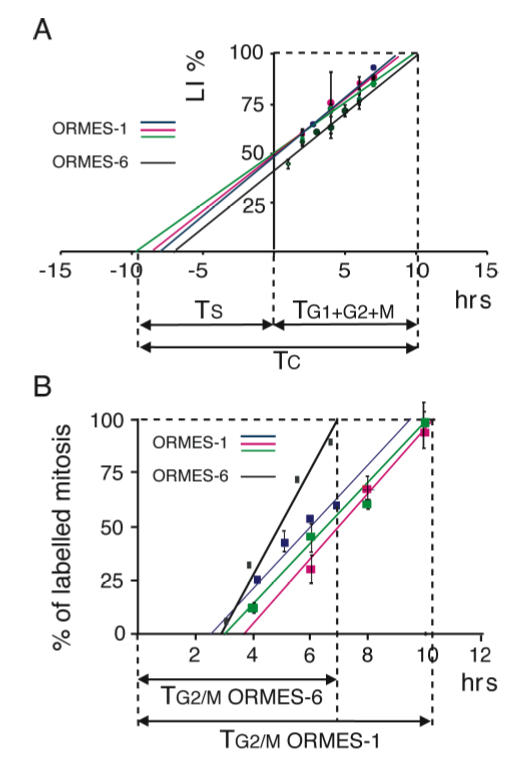
Duration of individual phases of the ORMES-1 and ORMES-6 cell-cycle by means of cumulative BrdUrd incorporation and Percentage of Labelled Mitosis (PLM) techniques. (A) Determination of Tc (length of the total cell-cycle), Ts (length of the S-phase) and TG1+G2+M (length of the G1+G2+M phases) by cumulative BrdUrd incorporation. ORMES-1 and ORMES-6 cells were plated at a density of 0.3 × 10⁵ cells per cm2. Three days after plating, cells were refed with fresh medium containing 50 μM BrdUrd, further cultured for 1 to 10 hours, then processed at regular time intervals for dual detection of Oct-4 expression and BrdUrd incorporation. The four curves correspond to the percentages of BrdUrd+/Oct4+ cells (labelling indices, LI) calculated in four independent experiments [three experiments carried on ORMES-1 (red, green and blue curves), and one experiment carried out on ORMES-6 (black curve)]. For each curve, values are means and SEM calculated from 3 replicates (replicates are sister coverslips from which individual LI are calculated). Projection of the extrapolated 100% LI value on the x-axis returns the duration of G1+G2+M phases (TG1+G2+M). Projection on the negative limb of the axis returns the duration of the S-phase (Ts). (B) Determination of TG2/M (length of G2/M) by the PLM technique. ORMES-1 and ORMES-6 cells were plated at a density of 0.3 × 10⁵ cells per cm2. Three days after plating, cells were exposed to 50 μM BrdUrd for 1 hr and further cultured for 1 to 10 hrs in BrdU-free medium. At regular time intervals, cells were processed for dual detection of Oct-4 expression and BrdUrd incorporation. The curves indicates the percentages of BrdUrd+/Oct4+ mitosis in four independent experiments [three experiments on ORMES-1 (red, green and blue curves), and one experiment on ORMES-6 (black curve)]. For each curve, values are means and SEM calculated from 2–3 replicates (replicates are sister coverslips from which individual percentages are calculated). Projection of the extrapolated 100% value on the x-axis returns the duration of (TG2+M). The G1 duration has been calculated by substraction of TG2+M from TG1+G2/M using values obtained from sister cultures, which values are indicated in the same color code (i.e. the red curves in A and in B come from sister cultures).