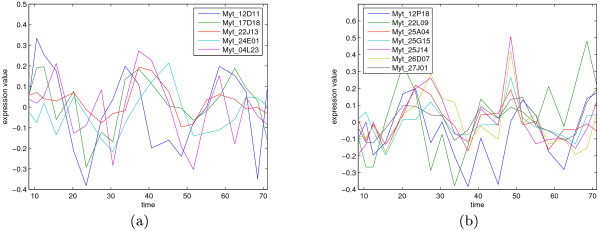
Figure 6.
The grouped periodic time series. Two groups of periodic time series signals measured from the mussel Mytilus Californianus. The x-axis is time in hours and the first time point corresponds to 8:40 am. The approximately 24-hour cycle can be seen well. The figure legends show the gene names corresponding to the plotted time series.

