
Figure 7.
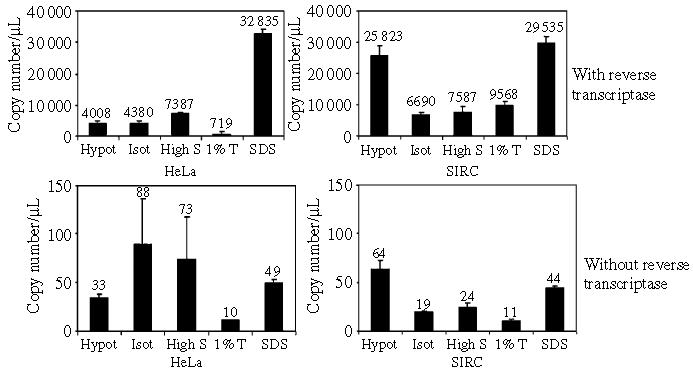
Viral RNA distribution in HeLa and SIRC cells. Cells were infected with the same dose of HIV vector, incubated 2 h at 4 °C and then 4 h at 37 °C. Infected cells were subjected to a stepwise fractionation procedure as described in Figure 5A in RNAse-free conditions. Total RNA was extracted, and samples were treated with RNAse-free DNAse I. After re-purification of the RNA, reverse transcriptase was used to perform first-strand cDNA synthesis. Control reactions were incubated in parallel in the absence of reverse transcriptase. Viral RNA copy number was measured by real-time PCR. Bars represent the mean ± standard deviation of triplicate experiments. Hy, hypotonic buffer; Iso, isotonic buffer; HS, high salt buffer; 1%T, 1% Triton-X buffer; SDS, SDS buffer.