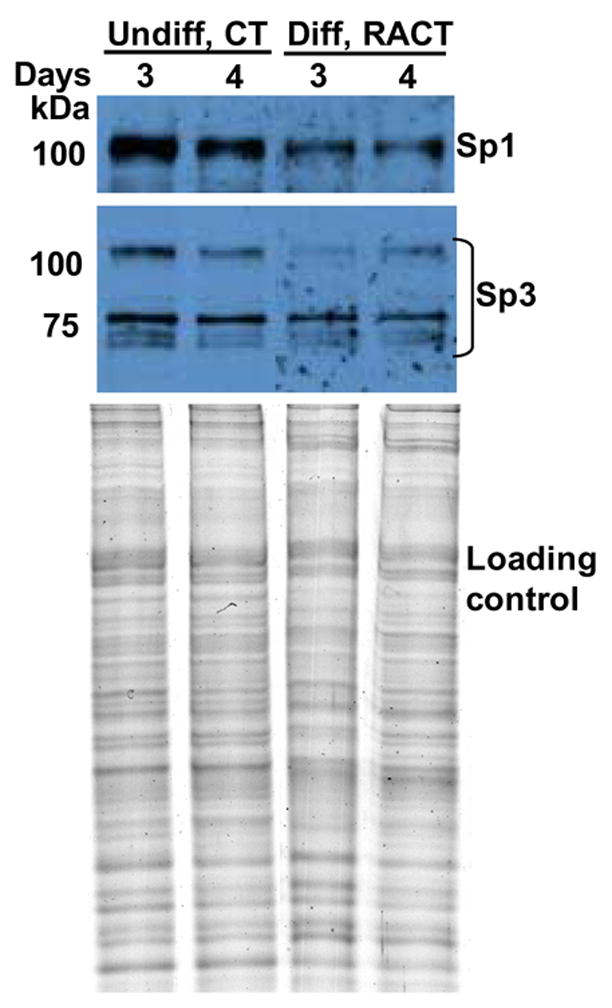
Fig. 3. Western blot analysis of Sp1 and Sp3 levels in nuclear extracts from undifferentiated or differentiated F9 cells.

Nuclear extracts (4 μg protein) from cells treated with CT or RACT for 3 and 4 days as indicated were separated by SDS-PAGE, transferred to a nitrocellulose membrane, and incubated with polyclonal antibodies to Sp1 and Sp3. The bottom panel shows a Coomassie Blue-stained gel of the same amount of each extract indicating that similar amounts of protein were loaded for each sample.
