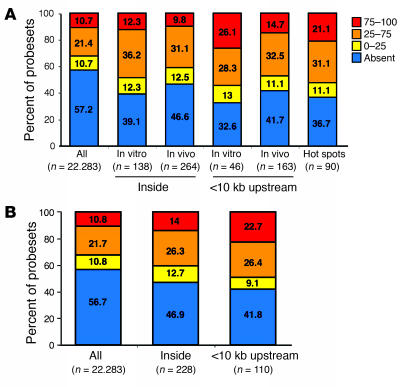
Figure 3. Gene expression profiling of genes hit by retroviral vectors.
(A) Correlation between insertion sites and gene expression profile of CD34+ cells at the time of transduction. The expression level profile of all probesets present on an Affymetrix HG-U133A microarray was determined in CD34+ cells and compared with the expression profile of probesets corresponding to targeted genes (inside or <10 kb upstream) by retroviral vector insertion in preinfusion CD34+ cells (in vitro) and cells after GT (in vivo), respectively, or in both samples. Bars show the percentage distribution of expression levels classified as present and absent by Affymetrix MAS 5.0 software. The present probesets were categorized in 3 subgroups according to 2 cutoffs identified by first (0–25) and third (75–100) quartiles of expression levels. (B) Correlation between insertion sites and genes expressed in T cells. Comparison of expression level of all probesets versus probesets of genes hit (inside or <10 kb upstream) by retroviral vector insertion and found in T cells of patients with ADA-SCID after GT. Analysis was performed as in A.

