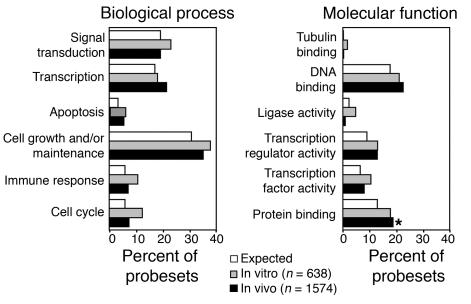
Figure 4. Functional clustering of targeted genes by GO.
The probesets of genes targeted (inside and within 30 kb) by retroviral insertion were classified in accordance with GO criteria. Each bar refers to the percentage of all targeted probesets falling within a specific gene category. The difference between groups was tested by both Fisher exact test and EASE score, corrected for multiple comparisons with the Bonferroni-Holm correction. The only difference was revealed for in vivo sample versus expected in “protein binding” category (*P = 0.022, Fisher exact test; P = 0.034, EASE score). No major differences were observed in RIS distribution and hierarchical clustering between lymphoid and myeloid cells.

