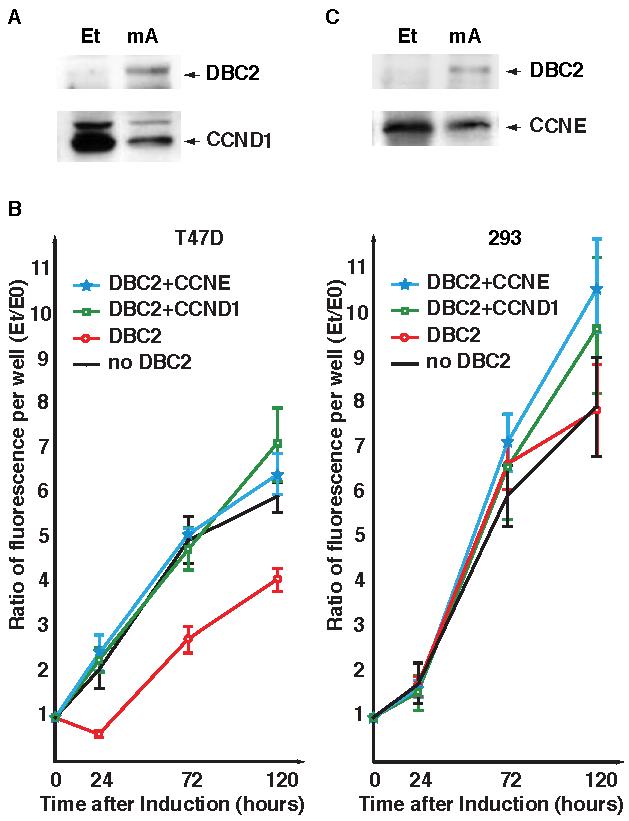
Figure 3. Growth curves of T47D transformants.

A. Western blot analysis of T47D39 transfected with pCMV-CCND1. Et and mA in the figure stand for ethanol and muristerone A, respectively. DBC2 was detected by anti-DBC2 antibody (N15) and CCND1 was detected by anti-CCND1 antibody (M-20). CCND1 protein decreased after DBC2 expression, but still remained detectable. B. Growth curves of T47D and 293 cells. The left pane shows growth curves of T-47D transformants and the right pane, those of 293. The average ratios over time point 0 are plotted in the graph. The error bars represent 2SD. In both panes, solid circles with black lines represent transformants with the empty vector without DBC2; open circles (red), those with the empty vector and DBC2 expression; open squares (green), those with pCMV-CCND and DBC2 expression; stars (blue), those with pCCND-CCNE and DBC2 expression. T47-D cells exhibited slow growth when DBC2 was expressed. DBC2's influence was offset by either CCNE or CCND1 expression. None of the manipulations disturbed the growth of 293 cells. C. Western blot analysis of T47D39 transfected with pCCND-CCNE. DBC2 was detected by anti-DBC2 antibody (N15) and CCNE was detected by anti-CCNE antibody (H-145). A significant amount of CCNE was observed in T47D39 cells before and after DBC2 expression.
