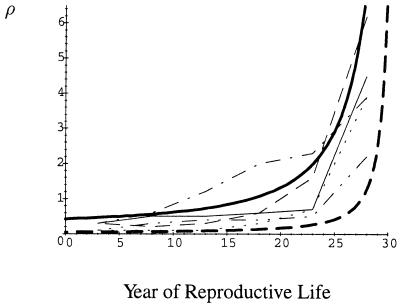
Figure 1.
Maternal age dependence of trisomy. Vertical axis (ρ) is percentage of clinically recognized pregnancies that are trisomic. Horizontal axis (t) is year of reproductive life (female has a 30-year reproductive life span). Thin lines are data from ref. 3. Solid, C group chromosomes; dash, D group chromosomes; dot, chromosomes 17–20; dot–dash, chromosome 16; dot–dot–dash, chromosome 21. Thick lines are model predictions using N(z̄) = φz̄2 and μ(z̄) = μ0 + βz̄2. Solid, r = 0.5; α = 5; μ0 = 0.05; φ = 1/300; β = 0.005. Dotted, the same values except r = 0.75. Model predictions were calculated by using scientific workplace 2.5.

