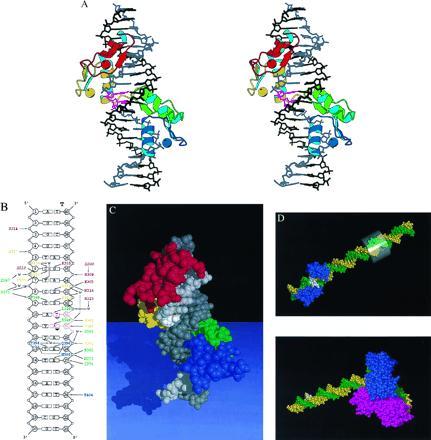
Figure 2.

Structure of the ΔYY1–initiator element complex. (A) Stereoview of the ΔYY1–DNA complex. The protein is shown as a ribbon representation, the DNA as a stick model, and the zinc ions as spheres. YY1 zinc fingers are colored red, yellow, green, and blue from N to C termini. The template strand of the DNA is colored grey, with the nucleotides corresponding to the two transcription start sites shown in purple, and the nontemplate strand is colored black. RNA synthesis proceeds downwards in this view. (B) Schematic representation of the ΔYY1–DNA interactions. The complete sequence of the crystallization oligonucleotide is shown, with the template strand labeled “T.” Protein–DNA contacts are color coded as in A by their zinc finger of origin. Supporting interactions that stabilize side chains making DNA contacts are also shown in italic. The two transcription start sites are labeled with arrows denoting the direction of transcription (▿ and ▾ for dominant). Enthalpically favorable interactions include salt bridges (<4 Å), hydrogen bonds (<3.5 Å), van der Waals contacts (<4 Å), and a number of water-mediated bridges (denoted with “w”). (C) Space-filling representation of the ΔYY1–DNA complex. The protein and DNA are colored as in A, with the nucleotides corresponding to the two transcription start sites on the template strand shown in white. (D) Space-filling representations of the ΔYY1–P5 promoter complex (Upper) and the complex of TBP and the adenovirus major late promoter (AdMLP) (25) (Lower). ΔYY1 and TBP are colored blue and the template and nontemplate strands of the DNA are colored green and yellow, respectively. The transcription start sites are denoted with white base pairs. A transparent cylinder surrounds the −24 to −31 region of the P5 promoter (the TATA element in the AdMLP).
