Figure 2.
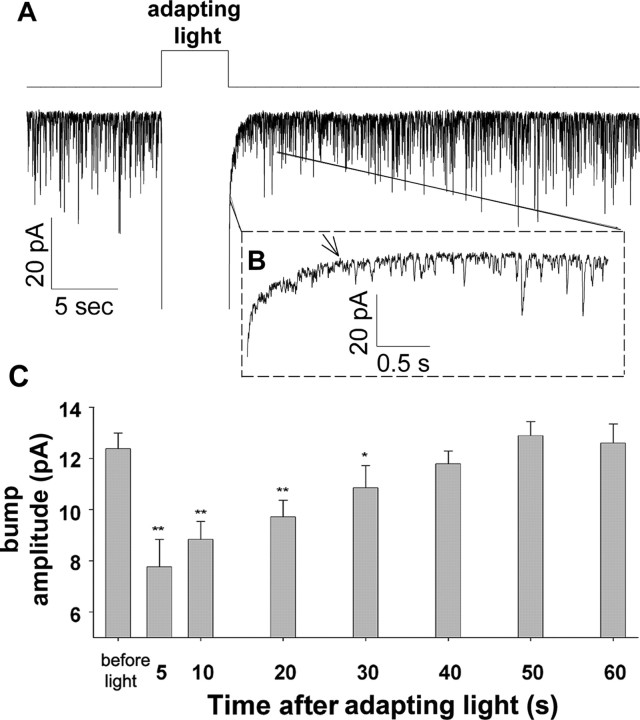
Fast adaptation affects bump amplitude. A, Dim red light (−log I = 5) elicited a continuous production of bumps, which was interrupted by application of intense orange light (adapting light, −log I = 1.0) for 5 s that elicited LIC with amplitude out of scale. B, The initial ∼4 s of A after the cessation of the adapting light is displayed in an expanded time scale as indicated. The arrow indicates 1 s after the cessation of the adapting light. C, Histogram plotting the average peak amplitude of the bumps before and after application of the adapting light as a function of time after the cessation of the adapting light as indicated. **p < 0.01, *p < 0.05, t test (n = 5).

