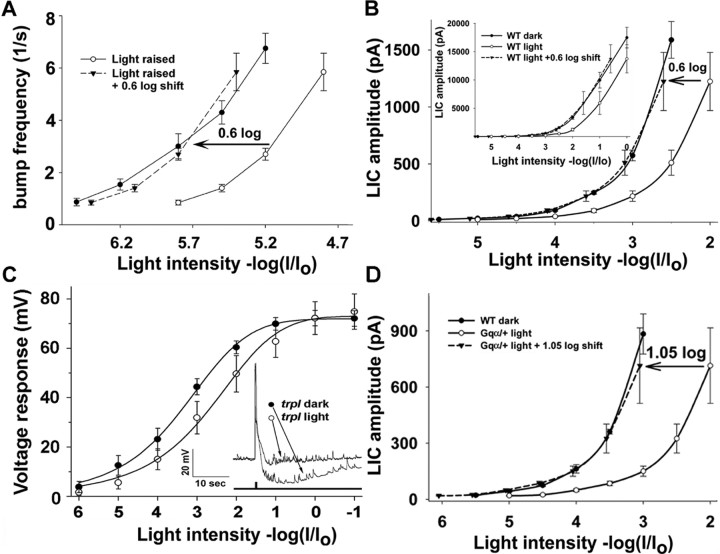
Figure 3.
Both the changes in bump frequency and in peak amplitude of the LIC can be used to characterize long-term adaptation. A, Average bump frequency (see Fig. 1) is plotted as a function of relative orange light intensity for light-raised and dark-raised flies (n = 4). To measure the sensitivity shift, the R-log-I curve of the light-raised flies was shifted by 0.6 log units (dashed line, triangles). Note that at higher light intensities, the bump frequency is underestimated because of superposition of the bumps. B, The peak amplitude of the LIC of dark- (filled circles) and light-raised (empty circles) flies is plotted against the relative orange light intensity at dim and medium range. The dashed line (triangles) shows a 0.6 log unit shift of the light-adapted curve, which fits the dark-adapted curve. Inset, The data in B are presented at the entire range of light intensities. Note that at the maximal light intensity, the peak LIC reached ∼20 nA inward current although no sign of saturation is observed. C, The average peak amplitude of the voltage responses, measured in the current-clamp mode from the trpl302 mutant, is plotted against the relative orange light intensity in a paradigm identical to that of B. The relative intensity of the intense white lights (−log I/I0 = −1) at saturated voltage responses is expressed in terms of equivalent intensity of orange lights (Schott OG 590 edge filter) that elicited the same light response. A significant shift toward more intense lights of 0.7 log units (p < 0.007; n = 8) was observed when dark-raised flies were exposed to prolonged illumination. C, Inset, The inset is sample responses to maximal orange light intensity. The afterhyperpolarization of the voltage responses of dark-raised flies (right arrow) and its absence in the responses of light-raised flies (left arrow) demonstrates the complexity of the voltage response to light. D, The R-log-I curve of light-adapted heterozygote Gqα1 (Gqα1/+, empty circles) is compared with the R-log-I curve of dark-adapted WT flies (filled circles). A shift of 1.05 log units of the heterozygote Gqα1 curve (dashed line) is required to fit the R-log-I curve of the mutant to that of dark adapted WT flies.

