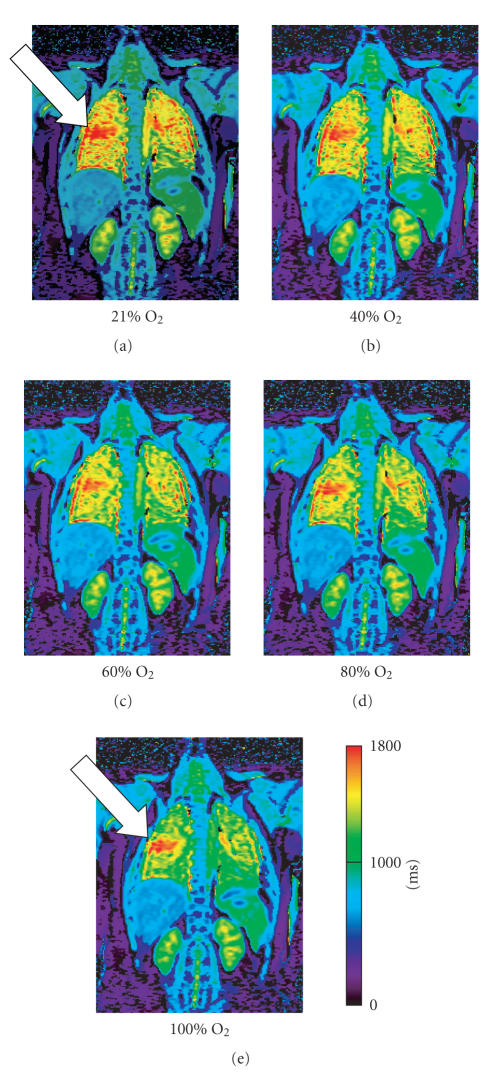
Figure 7.
T1 map (millisecond) of a patient with Cystic Fibrosis: inhalation of increasing oxygen concentrations demonstrates a steady shortening of T1 times in the healthy lung segments. The diseased tissue of the right mid lobe (arrow) distinguishes itself in that the T1 time remains relatively unchanged.

