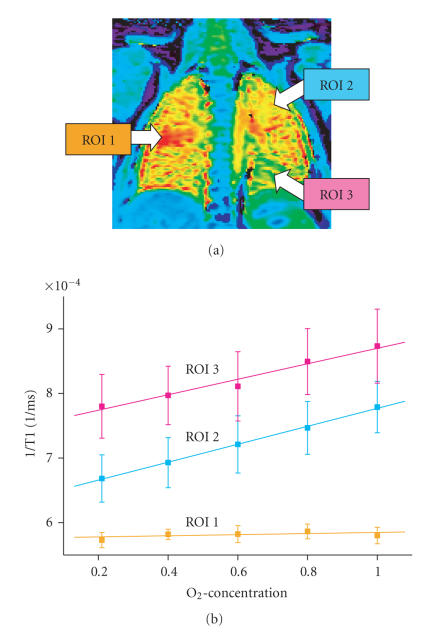
Figure 8.
Oxygen transfer function (OTF) of a patient with Cystic Fibroses from Ill. 6. Healthy lung segments (ROI 2 and 3) demonstrate a linear increase in relaxivity (= 1/T1) with increasing oxygen concentrations. The slope of the curve is a measurement of lung oxygen transport capacity. The diseased lung segment (ROI 1) shows no rise; there is therefore no oxygen transport.

