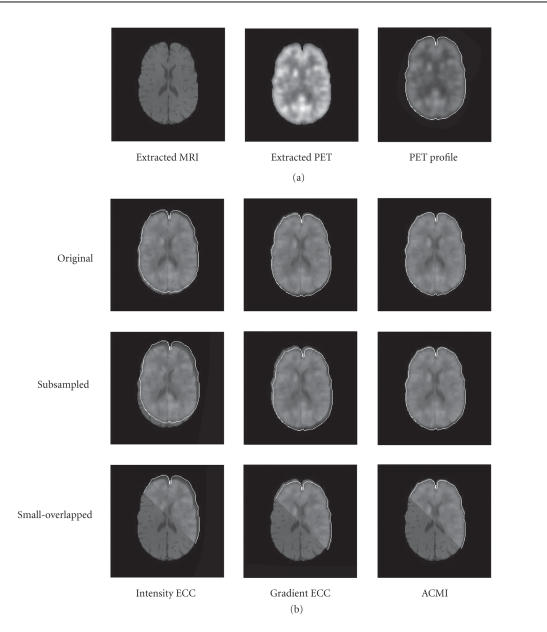
Figure 7.
Illustration of registration results of PET/MRI T1 pair with intensity ECC, gradient ECC, and ACMI. (a) The extracted brain of MRI T1 image (left) and the 50% transparent profile of extracted brain of PET image (right) are served as the underlying and the overlying, respectively. (b) The first row: registration results of original version using intensity ECC, gradient ECC, and ACMI; the second row: the corresponding results of subsampled version; the third row: the corresponding results of small-overlapped version.

