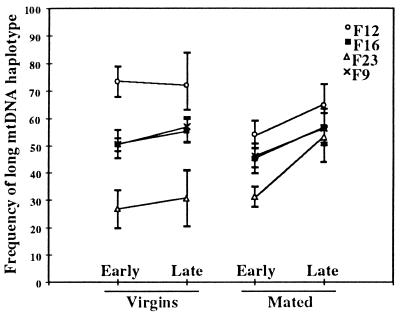
Figure 3.
The effect of mating and age on the proportion of long mtDNA within individual D. melanogaster. See Table 3 for statistical analysis. Means (symbols) and standard deviations (between bars) for samples of offspring from four different heteroplasmic mothers (F9, F12, F16, and F23). Each data point reflects the proportion of long mtDNA in a sample of about seven F1 female offspring from the respective mother. Early = day 2 and late = day 14.

