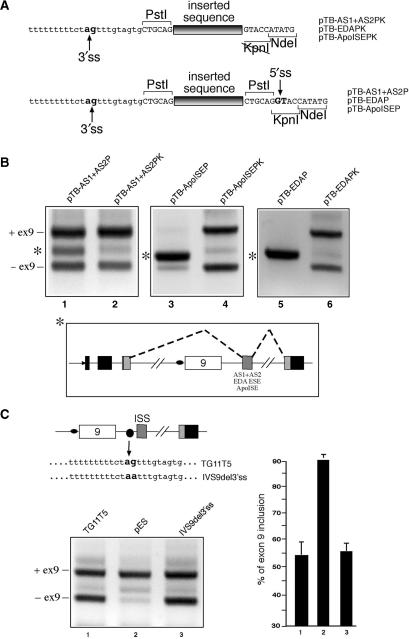
Figure 5.
(A) Shows a comparison of the different splice site composition when the AS1 + AS2, EDA and ApoISE sequences are cloned in the PstI/KpnI sites (upper panel, PK plasmid series) as opposed to the PstI site alone (lower panel, P plasmid series). The differing splice site composition in the region surrounding the point of insertion is indicated by arrows, with the conserved 3′ss ‘ag’ and 5′ss ‘gt’ nucleotides highlighted in bold. (B) Shows a comparison of the splicing profiles between P and PK plasmids carrying the AS1 + AS2, EDA and ApoISE sequence following transfection in Hep3B cells. The asterisk shows the extra band that is observed in the plasmids carrying the heterologous donor site downstream of the inserted sequence (pTB AS1 + AS2P, pTB EDAP and pTB ApoISEP). The lower panel shows a schematic diagram of the new splicing event indicated by the asterisk whilst the position of the transcripts including exon 9 (ex9+) and lacking exon 9 (ex9−) are marked on the right. (C) Left panel shows a transfection analysis of a TG11T5 mutant (IVS9del3′ss) carrying a ‘ag’ to ‘aa’ mutation in the cryptic 3′ss sequence. The CFTR exon 9 inclusion levels are comparable to those detected for the TG11T5 wild-type plasmid (C, right panel).

