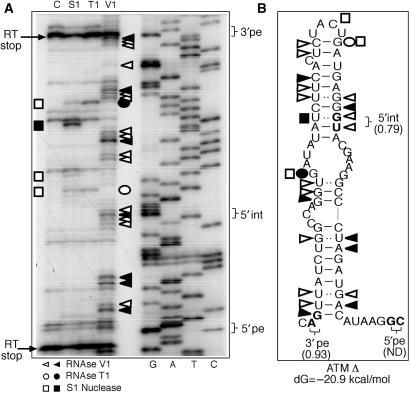
Figure 2.
In vitro transcribed ATM Δ RNA enzymatically digested with S1 nuclease, T1 and V1 RNases (A: lanes S1, T1 and V1). No enzyme was added to the RNA in a control reaction mixture (A: lane C). The RNA substrate on which this analysis was perfomed consisted of the entire RNA transcript from the ATM Δ RNA plasmid (∼700 nt). By providing an extensive background of flanking RNA molecule we have aimed to minimize any folding bias that may have derived from analysing the pseudoexon sequence alone. The cleaved fragments were detected by performing a RT reaction using a labelled 32P-end labelled antisense oligo and separating them in a denaturing 6% polyacrylamide gel. A sequencing reaction performed with the same RT primer was run in parallel to the cleavages in order to determine the cleavage sites (A: lanes G, A, T, C). Squares, circles and triangles indicate S1, T1 and V1 cleavage sites. Black and white symbols indicate high and low cleavage intensity, respectively. RT stops are indicated by arrows. The positions of the 3′pe, 5′int and 5′pe splice sites are indicated on the right. The observed cleavages were then compared with the ATM folding predictions by mFold (B).

