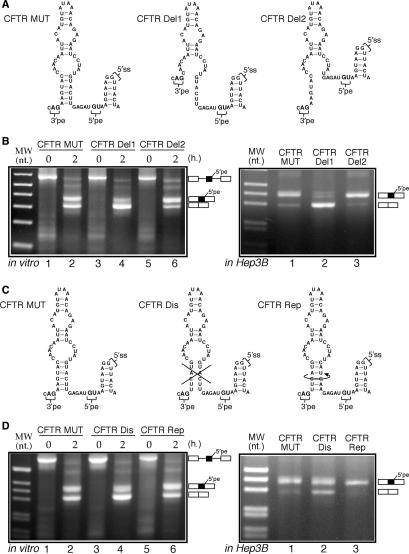
Figure 7.
(A) A schematic diagram of the two deletion mutants (CFTR Del1 and CFTR Del2) inserted in the PY7 system starting from the CFTR MUT plasmid. The splicing pattern displayed by these mutants either in vitro (left panel) or when transfected in Hep3B cells (right panel) is shown in (B). (C) The schematic diagram of an additional set of CFTR mutants (CFTR Dis and CFTR Rep) that were subjected to in vitro splicing (D: left panel) and transfected in Hep3B cells (D, right panel).

