Figure 5.
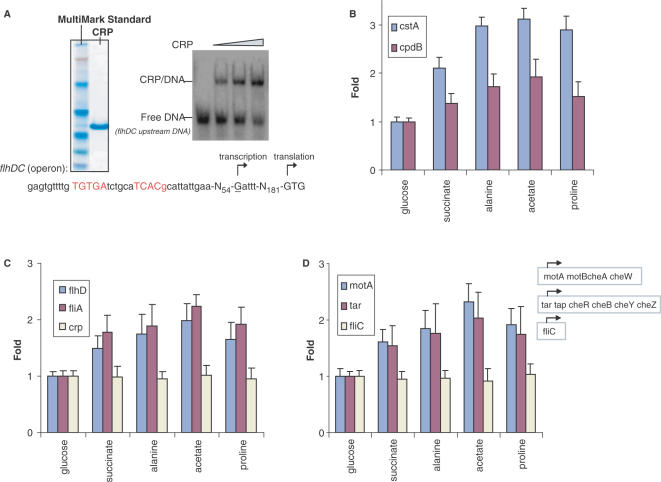
Carbon source effects on cell motility through activation of CRP. (A) SDS–PAGE gel shows purified CRP protein as well as MultiMark Standard and native gel shift assays show the binding of CRP to upstream DNA fragment of FlhDC operon. The palindromic consensus DNA-binding site for CRP dimer is shown in red. (B) The transcript abundance of two CRP-dependent genes, cstA and cpdB, in cells grown on different carbon sources. (C) The transcript abundance of flhD, fliA and crp in cells grown on different carbon sources. (D) The transcript abundance of σF-dependent genes, motA, tar and fliC, in cells grown on different carbon sources. Note, these carbon sources are of differing quality as defined by the resulting log-phase growth rates which are 0.97 generation h−1 in glucose, 0.50 generation h−1 in succinate, 0.34 generation h−1 in alanine, 0.21 generation h−1 in acetate and 0.13 generation h−1 in proline.

