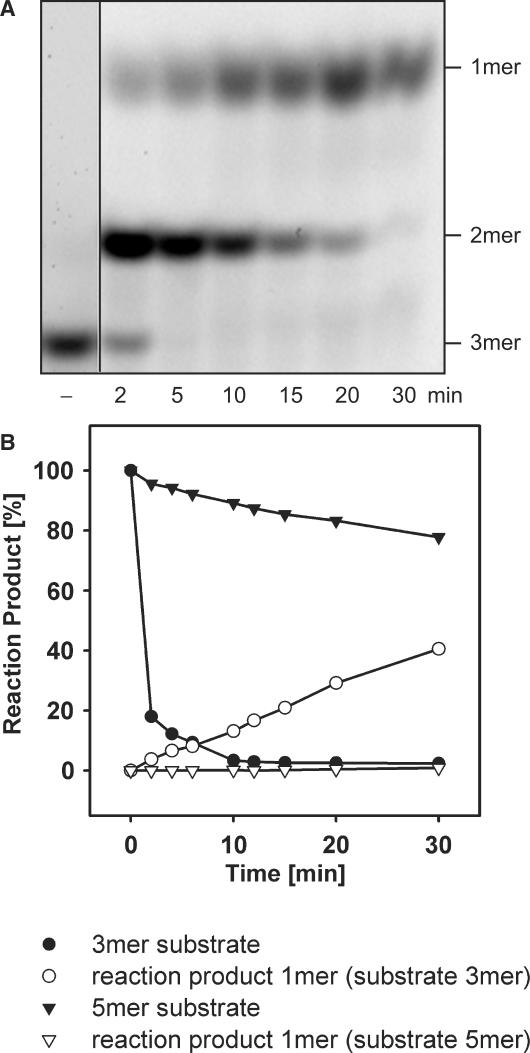
Figure 5.
Substrate preference of YtqI for RNA 3-mers. (A) YtqI-catalyzed degradation of RNA 3-mers. A 30 μl reaction contained 3 μg YtqI and 3.5 μM RNA 3-mers (5′Cy5-CCC3′). The minus indicates a control-lacking enzyme. (B) Comparison of YtqI-catalyzed degradation of RNA 5-mers or 3-mers. Shown are the amounts of substrate and reaction product monomer present at times indicated. Numbers indicate fractions of the total amount of fluorescent present in substrate, intermediate and complete reaction products. Reactions contained 2.7 μM substrate RNA 5-mers or 3-mers and 1.5 μg YtqI.

