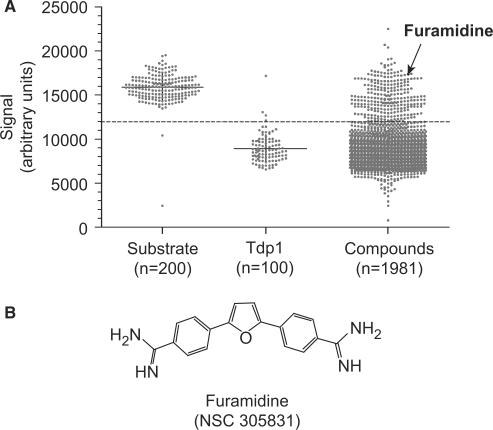
Figure 2.
Identification of furamidine as a Tdp1 inhibitor by high-throughput electrochemiluminescene assay. (A) Graph representing the effect of the 1981 compounds from the NCI-DTP diversity set on Tdp1 activity. Each dot indicates a signal value for a tested sample at 10 µM drug concentration. The substrate electrochemiluminescence (arbitrary units) is lost in the presence of Tdp1 (‘n’ indicates the number of samples). The effect of 1981 compounds screened is represented. Positive Tdp1 inhibitors prevent the loss of ECL signal. Dashed line represents 50% inhibition of Tdp1 activity. Furamidine was among the most potent compounds that inhibited Tdp1 activity. (B) Chemical structure of furamidine.

