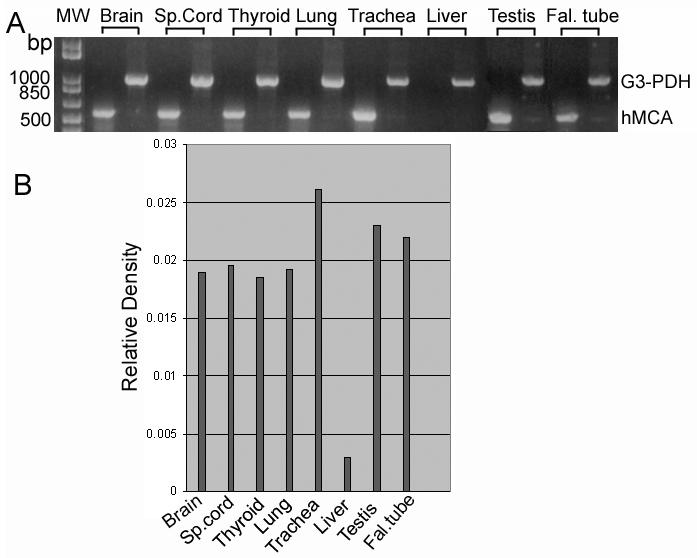
Fig. 8.

Semi-quantitative Reverse transcription polymerase chain reaction using total RNA from different ciliated tissues (A). Products generated by primer sets for hMCA were normalized against G3-PDH mRNA levels in the same set of samples. B) The relative densities of each band is plotted to show the level of message in different tissues.
