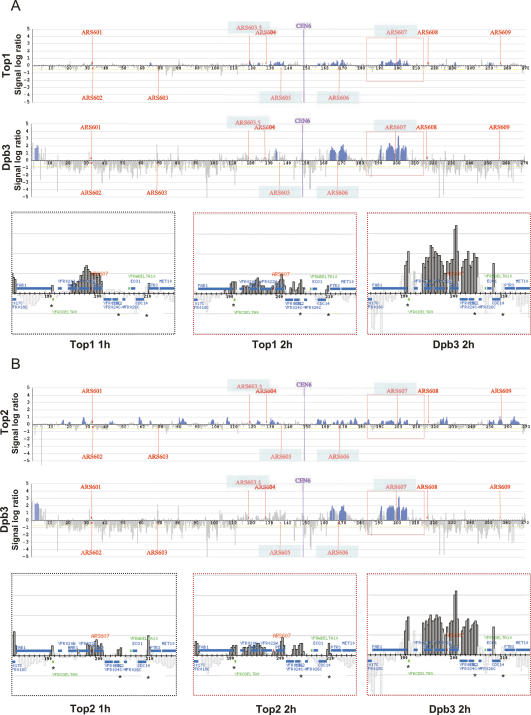
Figure 3.
Top1 and Top2 colocalize with Dbp3 at replication forks. Top1-10xFlag/Dpb3-3xHA (A) and Top2-10xFlag/Dpb3-3xHA (B) cells (CY7340 and CY7343 strains, respectively) were released from α-factor-induced G1 block and treated with 0.2 M HU for 2 h; cultures were then split and processed for ChIP with antibodies specific to either Flag or HA epitopes. Blue histogram bars in the Y-axis show the average signal ratio of loci significantly enriched in the immunoprecipitated fraction along chromosome VI in log2 scale. The X-axis shows kilobase units. Positions of all ARS sequences acting as replication origins on the chromosome and CEN sequence are indicated. The bottom panels show Top1/Top2 (after 1- and 2-h HU treatment) and Dpb3 (after 2-h HU treatment) clusters surrounding ARS607 element in detail. Blue horizontal bars represent ORFs. Asterisks indicate the position of tRNA genes.

