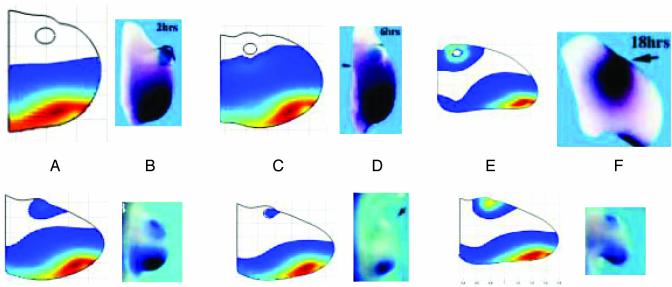
Fig. 6.
(Upper) Computational and experimental Ptc responses to bead implants. (Lower) Ptc response to tissue implants. (Upper) Numerical simulations of Ptc concentration 2, 6, and 18 h after bead implants (A, C, and E, respectively). (Lower) Ptc concentration 12, 16, and 20 h after tissue implant. (A, C, and E, respectively). Experimental results are from ref. 16 for ptc transcript concentration 2, 6, and 16 h after bead implants PI and for tissue implants, 4, 8, and 16 h PI. (B, D, and F, respectively). [Reproduced with permission from Drossopoulou et al. (16) (Copyright 2000, Company of Biologists Ltd.).] The simulation shows the experimentally observed posterior-anterior ptc expression wave followed by restriction of expression near the implant site. Tissue implant simulations show the initial expression near the implant site followed by a decrease and subsequent reestablishment of ectopic ptc expression. The figures for numerical simulations have been rescaled. The unscaled length of the proximal boundary in each of the numerical simulations is identical. The rescaling with respect to A Upper is as follows: C Upper, 1.8:1; E Upper, 3:1; A Lower, 1.9:1; C Lower, 2.1:1; E Lower, 2.7:1. The unscaled version of C Upper, for example, is 1.8 times larger than shown.

