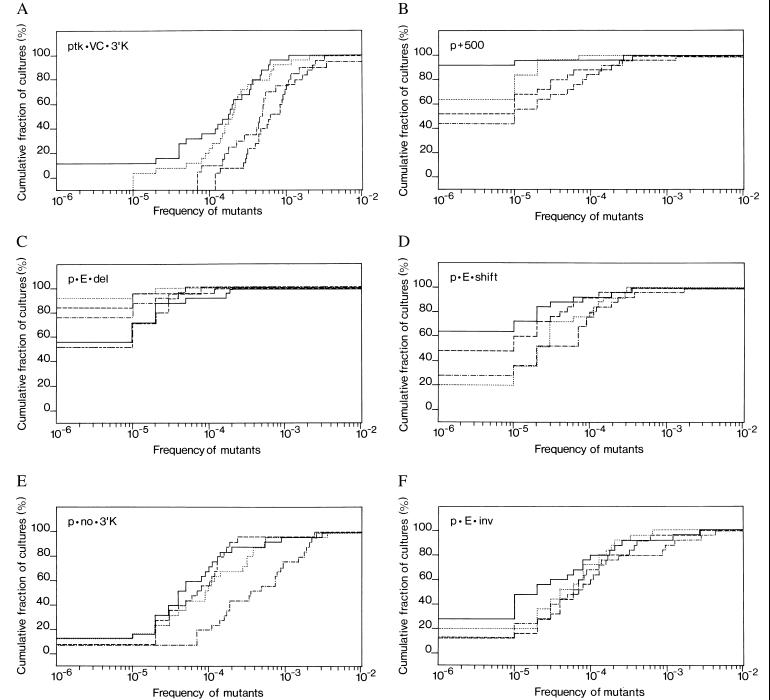
Figure 3.
Cumulative distribution of reversion frequencies for the plasmids tested. The plasmids used for transfection were: (A) ptk·VC·3′K, (B) p+500, (C) p·E·del, (D) p·E·shift, (E) p·no·3′K, and (F) p·E·inv. Horizontal axis: frequency of revertants (μ-producers) on a logarithmic scale. Vertical axis: fraction of cultures, in percent on a linear scale, with that frequency or less of revertants. In this graphic representation of quantitation of mutants the unit step in a curve represents a given culture, and each curve represents one transfectant, from which the cultures were derived. The 4–5 transfectants (curves) shown per construct resulted from independent transfection events. Plotting the cumulative frequencies rather than the frequencies themselves avoids the “gaps” that are caused by fluctuation and lead to a contiguous curve.

