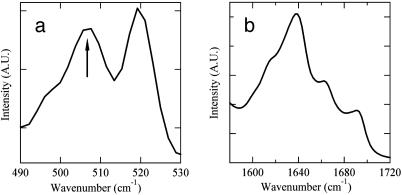
Fig. 3.
Conformation of Lanreotide in the nanotubes determined by vibrational spectroscopies. (a) Fourier transform (FT)-Raman spectroscopy. The figure shows the frequency range of disulfide bond vibrations. The 506-cm-1 vibration (arrow) indicates a gauche-gauche-gauche disulfide bridge. The 519-cm-1 vibration is characteristic of the Naphthalene ring of the d-naphthylalanine residue. (b) Fourier transform infrared spectrum of the amide I region (vibrations of the carbonyl groups) after subtraction of the water contribution. The percentages of backbone carbonyls involved in hydrogen bonds in different conformations have been estimated after deconvolution, i.e., 35% of antiparallel β-sheet (1,618 and 1,689 cm-1), 15% of turn (1,663 cm-1), and 50% of random (1,639 cm-1).

