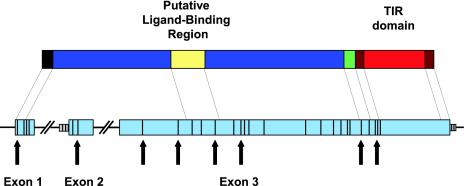
Fig. 1.
Positions of SNPs on genomic DNA, and position of putative ligand-binding region in protein. Positions of SNPs are shown with black lines on the blue coding regions and gray introns. Nonsynonymous SNPs are marked with arrows. Protein domains shown, with included amino acid residues (left to right): signal sequence (1-23), putative coreceptor-binding region 1 (24-273), putative ligand-binding region (274-368), putative coreceptor-binding receptor 2 (369-632), transmembrane region (633-653), proximal cytoplasmic region (654-672), Toll/IL-1 receptor (TIR) domain (673-819), and distal cytoplasmic region (820-841).

