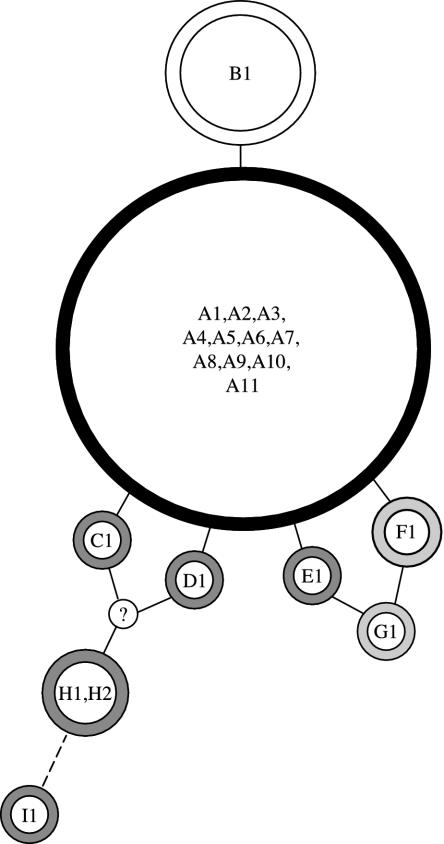
Fig. 2.
Haplotype relationships. Haplotypes at the amino acid level are shown as circles that include all equivalent haplotypes defined at the nucleotide level. Solid lines connect haplotypes related by a single amino acid substitution. A broken line indicates a distance of two amino acid substitutions. The frequency of each haplotype is depicted by circle size. Circle color denotes subspecies and historical continent of origin: white, taurine cattle only; black, common to all populations examined; light gray, found only in B. taurus indicus cattle of African descent; dark gray, found in indicine cattle. The haplotype denoted by “?” was not observed in our sample, but because of relationships with observed haplotypes it is predicted either to exist or to have existed in the B. taurus indicus subspecies outside our sample.

