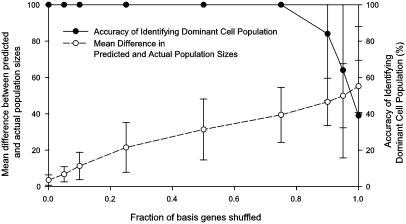
Fig. 3.
Comparing the quantitative and qualitative performance of the algorithm on synthetic data. One hundred cell populations were randomly generated by mixing basis experiments such that >50% of the population derives from one basis experiment. During expression deconvolution, noise was added to the basis experiments used for deconvolution by shuffling, for a given gene, the expression measurements across the basis experiments, simulating the presence of competing transcriptional programs besides the cell cycle. As the fraction of shuffled basis genes increases up to ≈85%, deconvolution correctly identifies the dominant cell population (filled circles), although the error in the numerical estimate of the population's size increases steadily (open circles). Error bar indicates ±1 SD from the mean of the 100 trials.

