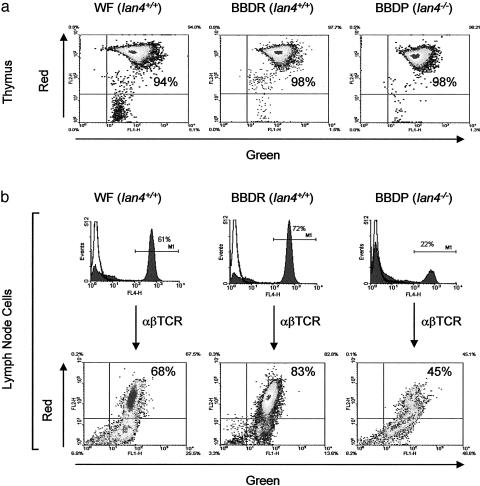
Fig. 2.
Mitochondrial membrane potential (Δψm). (a) The Δψm of thymocytes from Ian4+/+ (WF and BBDR) and Ian4-/- (BBDP) rats; shown are the relative percentages of cells fluorescing red (vertical axis, high Δψm) and green (horizontal axis, low Δψm). The majority of thymocytes from both Ian4+/+ and Ian4-/- rats display high Δψm. Data are representative of two independent experiments. (b) The Δψm of lymph node T cells. Horizontal bars in histograms indicate gates used to identify αβTCR+ cells. The T lymphopenia of BBDP rats is evident. The dot plots show that the percentage of T cells with high Δψm was lower in Ian4-/- than in Ian4+/+ rats. Data are representative of three independent experiments; the complete dataset is shown in Fig. 3a. Control incubations with the mitochondrial uncoupler carbonylcyanide m-chlorophenylhydrazone uniformly reduced the percentage of T cells with high Δψm to ≈4% (data not shown).

