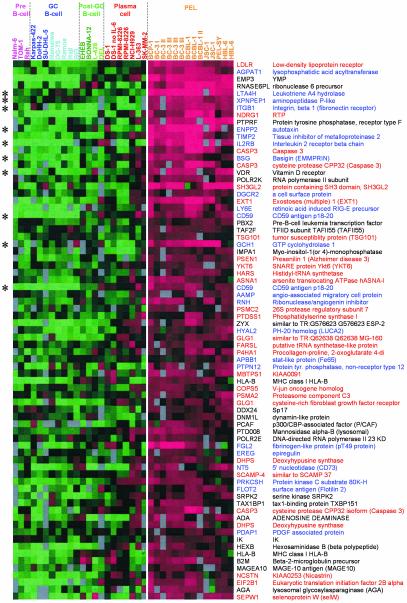
Fig. 3.
Identification of genes that define PEL. The 75 genes most associated with PEL by using a Mann-Whitney U test (P values from 2.91 × 10⁻⁷ to 1.36 × 10⁻⁴). Each column represents one sample, and each row represents one gene (identified by HUGO ID and gene name). The majority of genes can be classified by their involvement in either inflammation, adhesion, and invasion (blue) or ER, Golgi, and vesicle trafficking (red).

