Fig. 4.
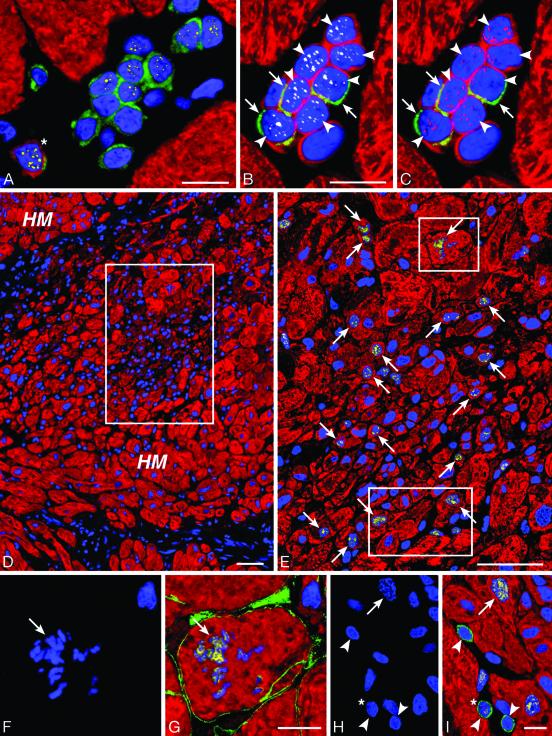
Intense growth in the hypertrophied heart. (A) Group of 12 c-kit-positive cells (green) surrounded by myocytes (red). Several nuclei express GATA-4 (yellow). One cell has a thin layer of myocyte cytoplasm (myosin, red, asterisk). (B and C) A second group of nine small cells with a ring of myocyte cytoplasm (myosin, red). Three of these cells exhibit c-kit (green; arrows) and seven (arrowheads) express both telomerase (B, white) and MCM5 (C, purple). (D) Low-power field of a cluster (rectangle) of small poorly differentiated myocytes within the hypertrophied myocardium (HM). Myocytes are labeled by cardiac myosin (red) and nuclei by propidium iodide (blue). The area in the rectangle is illustrated at higher magnification in E, in which Ki67 (yellow) labels a large number of myocyte nuclei (arrows). The two small rectangles delimit areas shown at higher magnification in F-I. A mitotic nucleus with metaphase chromosomes (F and G; arrows) is positive for Ki67 (G, yellow) and the boundary of the cell is defined by laminin (G, green). Another mitotic nucleus (H; arrow) is labeled by Ki67 (I, yellow; arrow). c-kit-positive cells (I, green; arrowheads) are near the mitotic myocyte. One shows Ki67 (I, yellow; asterisk). (Bars = 10 μmin A-C and F-I; bars = 50 μmin D and E).

