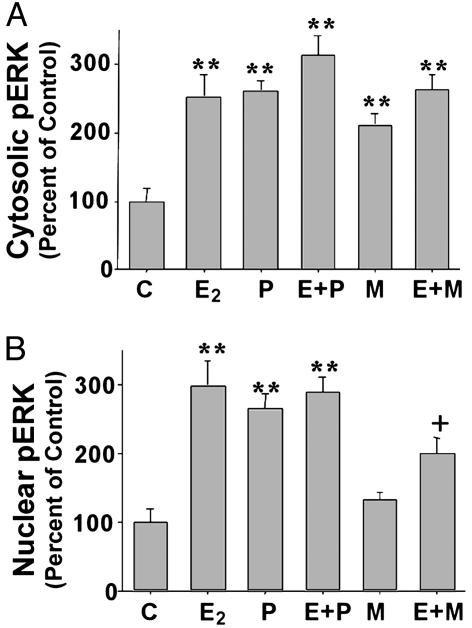
Fig. 5.
Subcellular compartmentalization of the fluorescent intensity of the pERK signal is altered by E2, P4, and MPA. Bar graphs represent relative fluorescence intensities for pERK localized in cytoplasm (A) and nucleus (B)of primary hippocampal neurons treated with vehicle (C), E2 (E), P4 (P), and MPA (M). Data are presented as mean ± SEM; **, P < 0.01 as compared with control; +, P < 0.0 as compared with E2 alone; n = 20 neurons.

